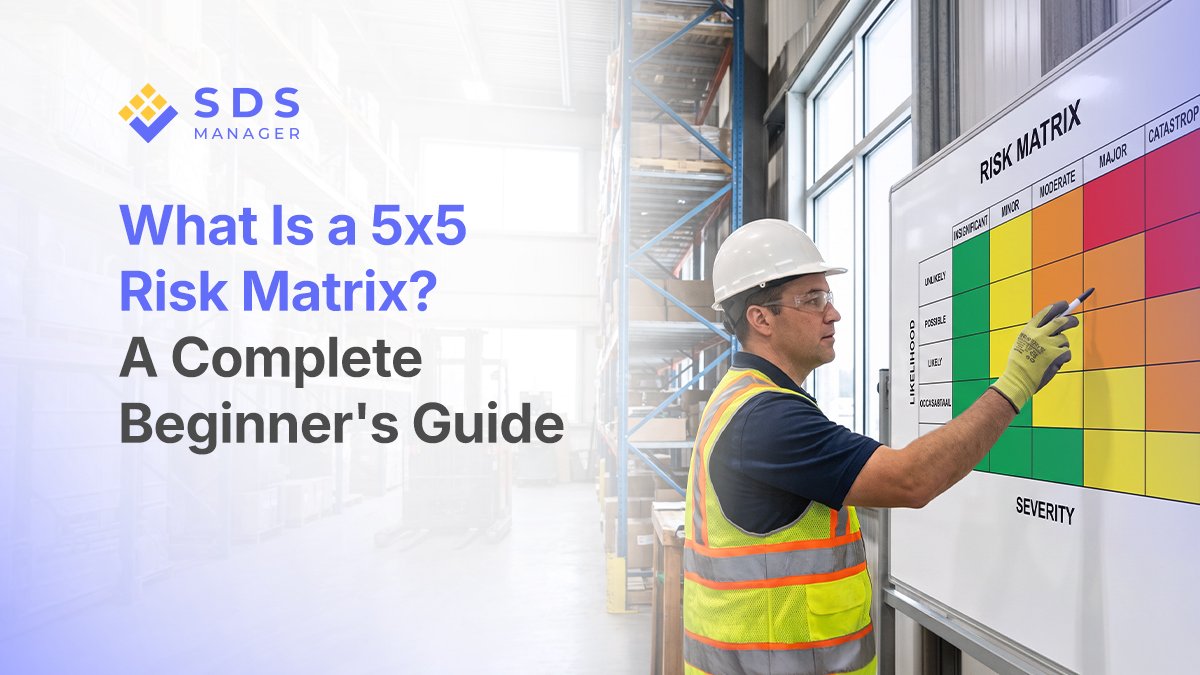
If you have ever tried to decide which of ten open hazards to fix first with no shared way to rank them, you already know the problem a risk matrix solves.
One person on the team calls a chemical spill risk "high," another calls the same risk "medium," and neither can say exactly why. Risk gets assessed through several methods, from full quantitative modeling to formal risk registers.
A risk assessment matrix is what most teams reach for first, because it needs a whiteboard and two simple scales rather than a statistician.
In this article, we cover what the scores actually mean, how to build and read the 5x5 grid, how to score a real risk step by step, and where the tool stops being useful.
Key Takeaways
- A 5x5 risk matrix scores risk by multiplying a 1 to 5 likelihood rating by a 1 to 5 severity rating, giving 25 possible score combinations to rank risks against each other.
- Scores get grouped into color bands, commonly green through red, that signal how urgently a risk needs attention, but where each band starts and ends is a decision your team makes, not a fixed formula.
- The matrix ranks risks against each other. It does not calculate an exact probability or a dollar cost, and treating a score of 12 as twice as bad as a 6 is a common misread.
- Most teams use a 5x5 grid because it gives more resolution than a 3x3 without asking for more precision than anyone can realistically estimate.
- Likelihood and severity levels only work when each one has a concrete example behind it, such as a past incident or near miss; a bare label like "Possible" or "Major" means something different to every person scoring it.
- A risk score reflects the conditions at the time it was scored, so a completed 5x5 risk matrix needs a set review and rescore schedule, not a one-time filing.
What Is a 5x5 Risk Matrix?
A 5x5 risk matrix is a grid that scores a risk by rating how likely it is to happen and how bad it would be if it did, each on a scale of 1 to 5, then multiplying the two numbers together.
The result is a score between 1 and 25 that places the risk in a color band, from low to critical, so a team can compare many risks at a glance and decide what to act on first.
The "5x5" name just means five levels on each axis, giving 25 possible combinations against the 9 a 3x3 matrix offers. That extra resolution separates a genuine near miss from a routine annoyance, without asking a team to estimate detail it does not actually have.
Think of the grid as a sorting tool, not a precision instrument. It tells you what to look at first, not the exact odds of it happening.
How a 5x5 Risk Matrix Works: Likelihood x Severity
Two ratings drive every score on the grid: how likely the risk is to occur, and how severe the outcome would be. Neither number means much on its own, which is why the matrix combines them rather than using either one alone.
A risk that is almost certain to happen but only causes a scraped knee sits in a very different place than a risk that is rare but could be fatal. Multiplying the two scales is what keeps that distinction visible.
What Do the Likelihood Levels Mean?
The likelihood scale runs from Rare to Almost Certain, and each level needs a real-world anchor, or it becomes a guess. A workable five-level scale looks like this:
- Rare: could happen, but only in exceptional circumstances you would not expect to see in normal operations.
- Unlikely: not expected to happen, though it is possible at some point.
- Possible: might happen at some point, and something similar has occurred before in a comparable setting.
- Likely: expected to happen in most circumstances, given how the work is currently done.
- Almost Certain: expected to happen, and possibly more than once, if nothing changes.
Anchor each level to something your team has actually seen or can point to, such as a past incident or a known near miss, so two people scoring the same risk land in the same place.
What Do the Severity Levels Mean?
Severity works the same way, running from Negligible to Catastrophic based on the worst realistic outcome, not the worst outcome you could ever imagine.
- Negligible: no injury, or discomfort that does not need treatment.
- Minor: first aid only, with no lost time.
- Moderate: medical treatment beyond first aid, or lost time, with a full recovery expected.
- Major: a serious injury, hospitalization, or permanent impairment.
- Catastrophic: a fatality, multiple serious injuries, or a total loss.
Score severity against the plausible worst case for this specific risk, not a worst case borrowed from an unrelated incident. That keeps the rating honest, not inflated.
Severity Beyond Injury: Scoring More than One Consequence
Severity does not have to mean physical injury. The same 1 to 5 scale can also score money lost, environmental harm, or regulatory trouble, using the same kind of concrete anchors, just about dollars, the environment, or compliance instead of injuries.
A chemical spill might score Minor for injury but Major for environmental impact if it reaches a waterway. When one risk touches more than one of these, score it against whichever one is worst, and write down which one drove the score so the next person can follow your thinking.
Environmental and regulatory issues, such as a spill that has to be reported or something an inspector flags, are worth scoring alongside safety for any chemical risk. A risk can look minor for injury and still carry a real cost elsewhere.
How Do You Calculate a Risk Score?
Multiply the likelihood number by the severity number to get the risk score. A risk rated Unlikely (2) on likelihood and Major (4) on severity scores 8, which lands in a middle band on most 5x5 grids rather than at either extreme.
That single number is what gets plotted on the grid in the next section, and it only means something once you know where it falls relative to the other risks on your list.
The 5x5 Risk Matrix Grid, Explained
The 5x5 risk matrix grid lays the two scales out as rows and columns, so every combination of likelihood and severity has one cell and one score.
Likelihood usually runs down the side and severity across the top, though either arrangement works as long as it stays consistent across your organization.
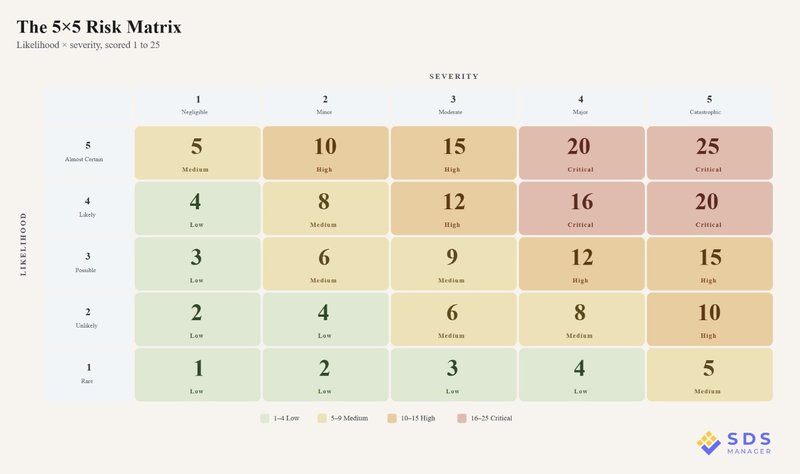
Once every cell has a number, a color band turns that number into a priority a whole team can read at a glance, no math required.
What Do the Colors Mean?
The colors on a risk matrix translate the numeric score into an action level, usually green for low, yellow for medium, orange for high, and red for critical or extreme. A common set of bands looks like this: 1 to 4 low, 5 to 9 medium, 10 to 15 high, and 16 to 25 critical.
No single standard body hands down universal cutoffs for where medium ends and high begins, and the standards that do publish example matrices do not agree with each other on where those lines fall. Your team sets the cutoffs for its own grid, based on how much risk the organization is willing to tolerate and how quickly it can respond to different levels.
A construction firm and a software company drawing the line between medium and high will reasonably land in different places. That is fine, as long as the choice is documented and applied the same way every time someone fills in the grid.
A printable risk assessment matrix template keeps that consistency intact instead of leaving the grid to be redrawn from memory each time.
How to Use a 5x5 Risk Matrix in 6 Steps
Filling in a 5x5 risk matrix is a short, repeatable process once the scales and bands are set. Here is how to work through it for any single risk.
Step 1: Identify the Hazard or Risk
Name the specific hazard or risk you are assessing, and be precise about what could actually go wrong rather than describing the general area of concern. "Forklift collides with a pedestrian in the loading bay" gives you something to score; "forklift safety" does not.
Learning hazard identification helps you catch risks you would otherwise miss by relying on memory alone.
Step 2: Score the Likelihood
Pick the likelihood level, from 1 (Rare) to 5 (Almost Certain), that best matches how often this specific risk is expected to occur given current conditions.
Base the score on what actually happens on site or in the project, including any near misses, rather than on how the process is supposed to work on paper.
Step 3: Score the Severity
Rate the severity, from 1 (Negligible) to 5 (Catastrophic), based on the worst outcome that is genuinely plausible for this risk, not a hypothetical extreme.
If existing controls already reduce how bad an incident could get, score the severity as it stands today, including those controls, not the raw hazard in isolation.
Scoring the hazard as it would be with no controls at all is inherent risk, and many organizations record both, since the gap between the two scores is a rough measure of what the controls are actually worth.
Step 4: Plot the Risk on the Matrix And Evaluate the Results
Multiply the likelihood and severity scores, find that number on the grid, and read off the color band it falls into. A score in the red band needs attention before work continues; a score in the green band can usually wait for routine review.
If a score feels too high or too low against a similar risk you already scored, revisit the likelihood or severity rating rather than accept the number at face value.
Step 5: Decide on Controls or Treatment
Match the response to the band the risk landed in, and work through the options in order: eliminate the hazard where you can, substitute it with something less hazardous where you cannot, and add engineering controls such as ventilation or guarding.
If that does not fully solve it, add administrative controls such as training or a changed procedure, and treat personal protective equipment as your last line of defense, not your first. This order, often called the hierarchy of controls, comes from standard safety practice, not from the matrix itself.
Log the chosen control, who owns it, a target date, and a review date somewhere the whole team can see, ideally in a shared risk register. That keeps the decision traceable and gives you something to check against later, instead of a control that only exists in someone's memory or a spreadsheet nobody reopens.
Step 6: Review and Reassess
Set a review date for every scored risk, and bring it back sooner if conditions change, such as a new process, a new chemical, or an incident related to that hazard.
A risk score reflects conditions at the time it was scored, and a matrix that never gets revisited slowly stops matching reality.
Worked Example: Scoring a Real Risk

Take a warehouse with a persistent slippery patch near a loading dock door, caused by rain blowing in whenever the door opens. Following Step 1, the hazard is specific: a worker slips on the wet floor near the dock door and falls.
For Step 2, records show this has caused two near misses in the last year but no injury yet. That points to a likelihood of 2, Unlikely rather than Possible, since it has not become a recurring pattern.
For Step 3, a fall on a hard warehouse floor could plausibly cause a fracture or a head injury requiring hospital treatment, which lands at a severity of 4, Major. Multiplying those gives a score of 8, which falls in the medium band on a standard 5x5 grid.
A high-band score calls for a control before the next rainy shift, not a routine wait-and-see: a mat and a wet-floor sign address the immediate hazard, and the recurring pattern justifies logging a longer-term fix, such as a door awning or a floor drain, with an owner and a short review window rather than leaving the interim fix as the final answer.
Why Teams Use a 5x5 Risk Matrix
A 5x5 risk matrix gives a team a shared language for risk, so a safety lead, a supervisor, and a new hire can look at the same score and agree on roughly how urgent it is.
That shared reference point is what makes prioritization possible across a list of dozens of risks instead of relying on whoever argues loudest in a meeting.
The same grid works across very different kinds of risk, from a physical hazard on a job site to a chemical hazard tied to a specific product.
Scoring Chemical Risk Directly from a Safety Data Sheet
A safety data sheet already contains most of what a 5x5 score needs. The work is translating what is on the sheet into the two ratings, instead of guessing them from scratch.
Severity starts with Section 2 of the sheet, where the hazard warnings live. A warning that the substance can be fatal or cause lasting harm points toward the top of the severity scale, while a warning about mild, short-lived irritation points toward the bottom, assuming normal, expected exposure.
Treat that as a starting point to check against how the substance is actually used, not a rule to apply blindly. How someone is exposed, for how long, and how concentrated the substance is all still matter.
Likelihood comes from Sections 7, 8, and 9 of the sheet: how much of the substance is used and how often, how easily it evaporates or becomes airborne, whether the exposure gets close to a recognized safe limit, and what protections, such as ventilation, are already in place.
A task done for a few minutes once a month under a fume hood scores very differently from the same substance handled daily in an open room.
Controls work the same way here as in Step 3. Ventilation, closed handling equipment, and protective gear all lower the severity or likelihood you actually score, the same way any other control does.
Take a solvent decanting task as an example. The safety data sheet flags the solvent as flammable and warns that its fumes can cause drowsiness and dizziness, which together point to a severity of 4, Major, given the realistic risk of a fire or an overcome worker in an enclosed space.
The task happens twice a week with no ventilation in place, pouring the solvent from a drum into smaller containers by hand, which points to a likelihood of 4, Likely.
Multiplied, that is a score of 16, in the critical band, and the fix follows directly from the hazard warnings that produced the score: better ventilation and closed-transfer equipment, not just a respirator.
SDS Manager's chemical risk assessment tool automates this translation, scoring severity from the hazard warnings and likelihood from how much and how often a chemical is used, both already recorded in each safety data sheet, so nothing needs to be re-keyed by hand.
Where a 5x5 Risk Matrix Falls Short
A risk matrix is a prioritization tool, not a measurement instrument, and treating its output as precise is where most of the criticism aimed at it comes from.
Louis Anthony Cox Jr.'s widely cited 2008 analysis in the journal Risk Analysis examined the mathematical properties of risk matrices. It found real limits worth knowing before you lean on one for anything high-stakes.
A matrix is not very good at telling close risks apart. Cox found it can correctly rank only a small share, less than 10 percent by his estimate, of risk pairs picked at random, so most of the comparisons it makes should not be trusted at face value.
However, it can also get things backwards. When a risk's likelihood and severity pull in opposite directions, a matrix can score the smaller risk higher than the bigger one, which Cox called potentially "worse than useless" for making decisions.
A 5 x 5 risk matrix cannot tell you how to split a limited budget between different risks, either. That kind of decision needs a different tool; the matrix's categories were never built to answer it.
And the scores themselves come down to judgment, not fact. Deciding how bad an uncertain outcome really is cannot be done objectively, which is why two different people scoring the same risk can land on opposite ratings.
That is exactly why anchoring every level to something concrete matters so much. Cox concluded that matrices "should be used with caution, and only with careful explanations of embedded judgments," not treated as a stand-in for that judgment.
Why the Same Score Can Hide Very Different Risks
Here is something worth knowing: not every score from 1 to 25 is actually possible. Only 14 different numbers ever come up on a standard grid, because several likelihood and severity pairs multiply to the same result. A score of 4, for example, can come from three different combinations: 1 times 4, 2 times 2, or 4 times 1.
Some numbers never appear at all, such as 7, 11, 13, 14, or anything from 17 to 19 and 21 to 24, simply because nothing on a 1 to 5 scale multiplies to make them.
There is a bigger catch at the extremes of the grid. A Rare risk that would be Catastrophic scores a 5, and so does an Almost Certain risk that is only Negligible, so a rare fatality risk and a near-constant paper cut can land in exactly the same band.
That is Cox's second finding in action: a matrix can treat a rare, severe risk the same as a common, minor one, with no flag that the two actually need very different responses.
None of this means the score is wrong to use. It just means a single number should not replace a second look whenever a rare but severe risk, or a specific band boundary, is actually driving a decision.
What Do Standards Actually Say About Risk Matrices?
No single standard hands down universal cutoffs for where medium ends and high begins, and the standards that do publish example matrices do not even agree with each other.
ISO 31000, the most widely used risk management standard, lays out a process for identifying and weighing risk. It does not tell you to use a matrix, how many boxes it should have, or where the color bands should fall; it leaves all of that up to you.
ISO 45001, the safety management standard many organizations follow, does require working through the hierarchy of controls once a risk is identified, but it does not hand you a scoring grid either.
Even the standard that helped popularize the modern risk matrix, a US defense standard called MIL-STD-882, uses its own version: four severity levels instead of five, and numbered the opposite way, so its most severe level is 1 instead of 5.
Older standards, like an earlier joint Australian and New Zealand risk management standard, used their own versions too before folding into ISO 31000.
The takeaway is simple: your organization sets the cutoffs for its own grid, based on how much risk it is willing to live with and how fast it can respond to different levels. Write that choice down and use it the same way every time, because no outside standard is going to do it for you.
Common Mistakes That Make a Risk Matrix Useless
A few habits quietly wreck the value of an otherwise well-built matrix. Scoring without an anchor is the most common. Give every likelihood and severity level a written example, because "Possible" and "Major" mean nothing consistent between two people guessing.
Letting everything compress into the same one or two bands is another; if every risk on the list comes out "medium," the scales are too coarse to separate anything.
A score of 12 is also not mathematically twice as risky as a score of 6, and a decision that hinges on that kind of comparison needs a different tool.
Turn Risks into Solutions
A completed 5x5 risk matrix tells you where to look first, and that is the whole job it is built to do. The scores and colors are only as good as the anchors behind them.
Revisit your likelihood and severity definitions whenever a score feels off, and treat the highest-band risks as a starting point for a closer look rather than the final word.
If you are still tracking scores across separate spreadsheets, switch to a risk assessment tool with configurable matrices instead: it keeps every scored risk, control, and review date in one place, so a rating never goes stale just because no one remembered to reopen the file.
Frequently Asked Questions
Is a 5x5 risk matrix better than a 3x3 or 4x4 risk matrix?
A 5x5 risk matrix is not universally better than a 3x3 or 4x4 risk matrix; it fits most general workplace and project use because it offers more resolution than a 3x3 without demanding more precision than a team can realistically estimate. A 3x3 grid suits simple, low-stakes operations, while anything larger only pays off with enough data and history to justify the extra detail.
What Is the Highest and Lowest Score on a 5x5 Risk Matrix?
The highest possible score is 25 (an Almost Certain likelihood of 5 multiplied by a Catastrophic severity of 5), and the lowest is 1 (a Rare likelihood of 1 multiplied by a Negligible severity of 1). Every other combination falls somewhere between those two numbers.
How Often Should a Risk Matrix Be Reviewed?
A risk matrix should be reviewed on a set schedule, commonly every 6 to 12 months for stable operations, and sooner whenever conditions change, such as a new process, a new chemical, or an incident tied to that risk. Waiting for an annual review to catch a change from months ago defeats the purpose of scoring it in the first place.
Can a Risk Matrix Be Used for Financial or Project Risk, Not Just Safety?
Yes, the structure of a risk matrix works for financial, project, and operational risk, not only workplace safety, as long as the severity scale is redefined around the relevant consequence, such as cost overrun or schedule delay rather than injury. A risk assessment template built for a construction site typically blends safety and project risk on the same grid, since both threaten the same job.
What Is the Difference Between Likelihood and Probability on a Risk Matrix?
Likelihood is a ranked category, such as Rare or Likely, chosen by judgment and experience, while probability is a precise numerical chance, such as a 3 percent annual likelihood. A 5x5 matrix uses likelihood rather than probability because most teams lack the data to defend a specific percentage for every hazard on their list.
Is a Risk Matrix a Legal Requirement?
Risk matrices are not universally required; whether one specifically is required depends on the jurisdiction and industry you operate in, though most safety regulations do require some form of documented risk or hazard assessment. A matrix is one common way to meet that requirement, not the only method regulators recognize, so check the rules that apply to your own operation.

Arysha Alif Khan

Arysha Alif Khan is an EHS and chemical safety specialist with a background in biochemistry, biotechnology, and public health. She works closely with the product and regulatory teams to turn complex chemical regulations, SDS requirements, and workplace safety standards into clear, practical guidance for people.