Most UK health and safety programmes still measure success by counting what went wrong. Incident rates, lost time injuries, and RIDDOR reports all describe harm that has already happened.
That's a reasonable place to start, but it only tells a business what already happened, not what to do differently next time. Leading and lagging indicators are the distinction that explains why relying on outcome data alone falls short.
This article compares both types, shows where each one breaks down, and sets out HSE's framework for building a balanced set.
Key Takeaways
- The main difference between leading and lagging indicators is timing: lagging indicators record outcomes after they happen, while leading indicators track the conditions that shape whether an incident happens.
- Lagging indicators include metrics like RIDDOR-reportable injuries and lost time injury rate.
- Leading indicators include metrics like safety audit completion and near-miss reporting rate.
- HSE estimates that around half of qualifying RIDDOR-reportable injuries go unreported each year, which limits what lagging data alone can show.
- Leading indicators can be misleading too, since they measure activity rather than quality unless checked against outcomes.
- HSE's HSG254 guidance sets out a framework for building leading indicators tied to real hazards, not just easy-to-measure activity.
- A balanced safety programme tracks both types together rather than relying on either alone.
Leading Indicators Vs Lagging Indicators At A Glance
| Attribute | Leading indicators | Lagging indicators |
|---|---|---|
| Definition | Proactive measures of safety activity and conditions | Reactive measures of safety outcomes |
| What it measures | Inputs and processes, such as audits or training | Results, such as injuries or incidents |
| Timing | Tracked before an incident occurs | Recorded after an incident occurs |
| Purpose | Identifies and corrects risk before it causes harm | Confirms whether existing controls actually worked |
| Data source | Audits, inspections, near-miss reports, training records | Incident reports, RIDDOR submissions, insurance claims |
| Control | Within the organisation's direct control, since the activity is planned | Outside direct control, since it depends on whether an incident occurs |
| Frequency | Collected continuously or on a regular schedule | Collected only when an incident happens |
| Statistical reliability | Lower reliability per data point, needs a trend over time to mean much | Higher reliability per event, but low volume makes trends slow to build |
| Example metrics | Near-miss reports, audit completion rate, training hours | Incident rate, lost time injury rate, RIDDOR reports |
| Strength | Predicts risk and supports early intervention | Simple to measure and easy to benchmark |
| Limitation | Harder to standardise and can be manipulated | Only visible after harm has already occurred |
The table points to a few consistent differences. Leading indicators sit within an organisation's direct control and can be collected continuously, while lagging indicators only appear once an incident has already occurred.
That timing gap is what makes leading indicators useful for early intervention, but it also means each one needs a trend over time before it says much, whereas a single lagging event is unambiguous on its own.
What Are Lagging Indicators?
Lagging indicators measure outcomes that have already occurred, such as an injury, a RIDDOR report, or a lost workday. The data is recorded only after the event takes place, so it describes harm rather than what caused it. Because that data already exists in incident records, lagging indicators are usually the easiest metrics for a safety programme to start with.
What Are Examples Of Lagging Indicators In The UK?
UK lagging indicators closely align with RIDDOR, the regulation that sets out which incidents employers must report to the HSE.
- RIDDOR-reportable injuries: Fractures, amputations, and injuries causing more than 7 days off work all qualify.
- Lost time injury rate: The number of injuries resulting in time off work, measured against hours worked.
- Fatality rate: HSE recorded 124 work-related deaths in Great Britain in 2024/25, down from 138 the year before and below the five-year average of 133. .
- HSE enforcement following an investigation: Improvement or prohibition notices issued after HSE investigates a specific incident. Whether a notice follows a reportable accident or a broader safety incident affects how it's logged, so the distinction matters for keeping this data consistent.
- Work-related sickness absence: Days lost to work-related ill health, tracked separately from injury data.
What Are Leading Indicators?
Leading indicators measure the conditions and activities that influence whether an incident happens, such as a completed safety audit, a near-miss report, or a training session.
This data describes the state of the safety system rather than its results, tracking effort before harm occurs. Because it takes judgement to work out what actually predicts risk, leading indicators are harder to design well than lagging ones.
What Are Examples Of Leading Indicators?
Leading indicators tend to fall into categories based on what part of the safety system they check.
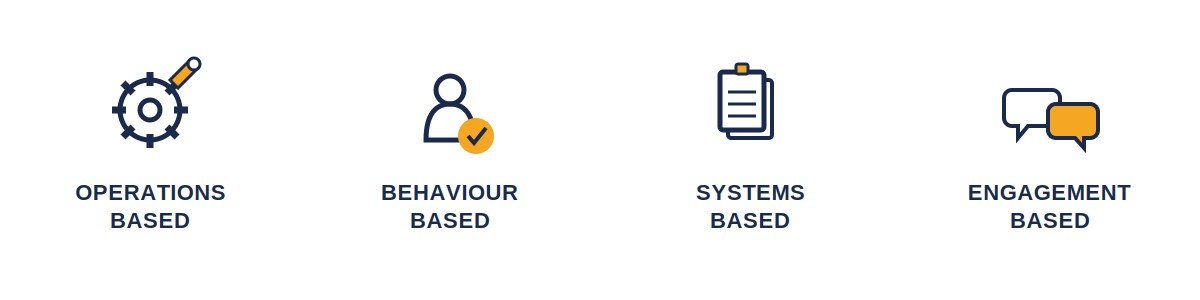
Operations-Based Indicators
Operations-based indicators check equipment and process reliability. A common example is the planned maintenance completion rate, which tracks how much scheduled maintenance actually gets done on time rather than deferred.
Behaviour-Based Indicators
Behaviour-based indicators check worker actions and compliance directly. PPE compliance rate and safe behaviour observations both fall here, capturing what workers actually do on site rather than what a policy says they should do.
Systems-Based Indicators
Systems-based indicators check the health of the management system itself. Safety audit completion rate and risk assessment review rate both measure whether the underlying processes are running as designed, not just whether workers are following them.
Engagement-Based Indicators
Engagement-based indicators check how much workers participate in safety activity beyond their own tasks. Near-miss reporting rate and toolbox talk attendance both reflect a workforce willing to flag risk before it becomes an incident.
Why Do Lagging Indicators Alone Fall Short?
Lagging indicators alone fall short because they only capture harm that gets reported, and UK data suggests that gap is significant.
HSE recorded 59,219 non-fatal employee injuries under RIDDOR in 2024/25, while the Labour Force Survey estimated around 680,000 workers were injured over the same period.
Most of that gap comes down to scope rather than non-compliance: RIDDOR only covers specific injury types and absences longer than 7 days, so a large share of the injuries the Labour Force Survey captures were never reportable in the first place.
Separately, underreporting adds to the gap on top of that, since some injuries that do meet RIDDOR's criteria still never reach the regulator. A safety programme built only on RIDDOR figures works from a partial picture, one that understates the true injury rate and arrives only after harm has already occurred.
Can Leading Indicators Be Misleading Too?
Leading indicators carry their own risk of distortion, usually because they measure activity rather than quality.
- Audit completion without depth is the clearest case. A completed audit counts the same whether it took ten minutes or two hours, so the metric can look healthy while the underlying inspection stays shallow.
- Reporting incentives create a similar problem in the other direction. Workers may under-report near misses if reporting is linked to a team's safety score. This quietly turns a leading indicator meant to surface risk into one that hides it. The same distortion shows up in training records.
- Training attendance without retention means a session logged as complete says nothing about whether the content actually changed behaviour on the floor.
- Target-driven gaming ties all of these together: setting a numeric target for any leading indicator can shift effort toward hitting the number rather than reducing the risk it was meant to track.
How Do Leading And Lagging Indicators Work Together?
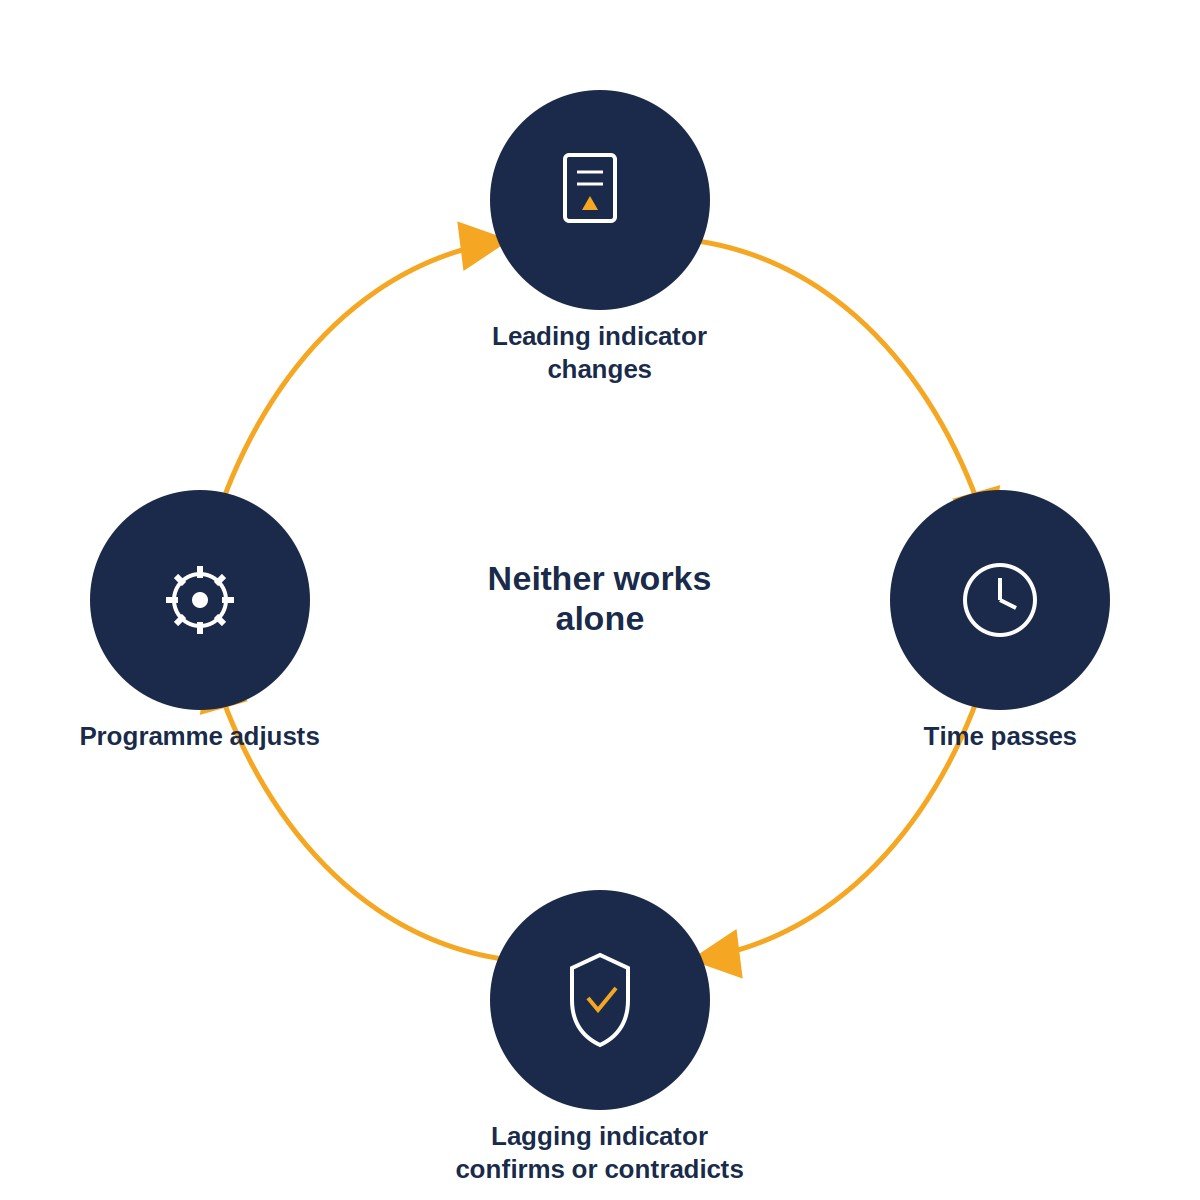
Leading and lagging indicators work together as a feedback loop, where one type validates the other over time. A leading indicator changes first, and a lagging indicator eventually confirms whether that change actually reduced harm.
Consider a site that raises its near-miss reporting rate through a new toolbox-talk campaign. Reports climb over a few months, which on its own says nothing about whether safety has actually improved. The lagging side settles that question. If lost time injuries fall over the same period, the leading indicator was tracking something real. If injuries stay flat or rise, the leading indicator was measuring activity that never touched the actual risk.
This is why the two types cannot be read in isolation. A leading indicator with no lagging data to check against just accumulates activity with no evidence it matters. A lagging indicator with no leading data attached offers no way to act until after harm has already happened.
Together, they close that gap. Leading indicators give a programme signals to act on early, and lagging indicators confirm afterward whether those actions actually worked.
How Does Hse's HSG254 Framework Help Build Leading Indicators?
HSE's HSG254 guidance was written for major hazard industries, but its underlying model for building indicators applies more broadly. It sets out a six-stage process, starting with identifying the specific hazards and hazardous events an operation faces. From there, it maps the risk control systems, sometimes called preventative barriers, that exist to manage each hazard.
Only after that mapping does HSG254 turn to indicators. Each risk control system gets reviewed for how it could fail, and one or more leading indicators get built around that specific failure mode.
A permit-to-work system might get an indicator tracking how often permits are issued without the required sign-off, for example, rather than a generic count of permits issued. The remaining stages cover agreeing how the data gets reported and acted on, setting targets and tolerances, and reviewing the whole set as risks or controls change.
The starting point is the hazard, not the metric.
Think of each risk control system as a barrier between a hazard and actual harm. HSG254's indicators exist to catch weaknesses in a specific barrier before several weak barriers line up at once and an incident gets through. Picking a metric first and looking for a hazard to attach it to gets this backwards, which is exactly what HSG254 warns against.
That principle carries over into workplaces outside major hazard industries choosing leading indicators for a general safety programme. Starting from the hazard rather than the metric is what keeps an indicator tied to something a safety failure would actually show up in.
How To Build A Balanced Set Of Safety Indicators
To build a balanced set of safety indicators, follow these steps:
- Start with the hazards and risk controls specific to the operation, not generic industry benchmarks.
- Choose 2 to 4 lagging indicators that already exist in reporting systems, such as incident rate and RIDDOR data.
- Pick 2 to 4 leading indicators, each tied to a specific risk control system that prevents one of those incidents, such as audit completion or near-miss reporting. Borrowing a generic list from another industry skips the step that makes an indicator actually predictive.
- Check leading indicators against lagging outcomes at least once a quarter, watching for gaming or drift.
- Set a review cycle of at least once a year, revisiting the indicator set sooner if risks or controls change.
- Report both types together. A leading indicator without a lagging counterpart has nothing to validate it against.
Measuring What Prevents Incidents, Not Just What Records Them
Leading and lagging indicators answer two different questions. A lagging indicator confirms what already happened, while a leading indicator signals what is likely to happen before it does.
Neither one alone gives a complete picture: lagging data arrives too late to prevent the harm it records, and leading data means little until it is checked against real outcomes. Using both together closes that gap, since leading indicators create the opportunity to act early, and lagging indicators confirm whether that action actually worked.
Keeping that comparison current gets harder as a business grows across sites, which is where the right tooling starts to matter. Incident management software that captures near misses alongside recorded incidents keeps both sides of the comparison in one place, making it easier to spot whether a leading indicator is actually tracking against the lagging outcomes it was meant to predict.
Frequently Asked Questions
Can leading indicators replace lagging indicators entirely?
No, leading indicators cannot replace lagging indicators entirely. Lagging data is still needed to confirm whether the leading indicators chosen are actually predicting the right outcomes.
How many indicators should a safety programme track?
Most safety programmes track a small set, typically 2 to 4 lagging indicators alongside a similar number of leading indicators. Tracking too many dilutes attention and makes trends harder to read.
Is RIDDOR a leading or lagging indicator?
RIDDOR is a lagging indicator. It records injuries and incidents after they have already occurred.
Why are leading indicators harder to measure than lagging indicators?
Leading indicators are harder to measure because they track behaviour and conditions, which are less standardised than a recorded injury.

Mehreen Iqbal

Started with a Bachelors in Microbiology, then a Masters in Public Health; Currently a Workplace Safety Expert.