If you manage safety in 2026, you are working from a picture that most injury reporting misses. The headlines track how many injuries happen. Almost none track how bad they are.
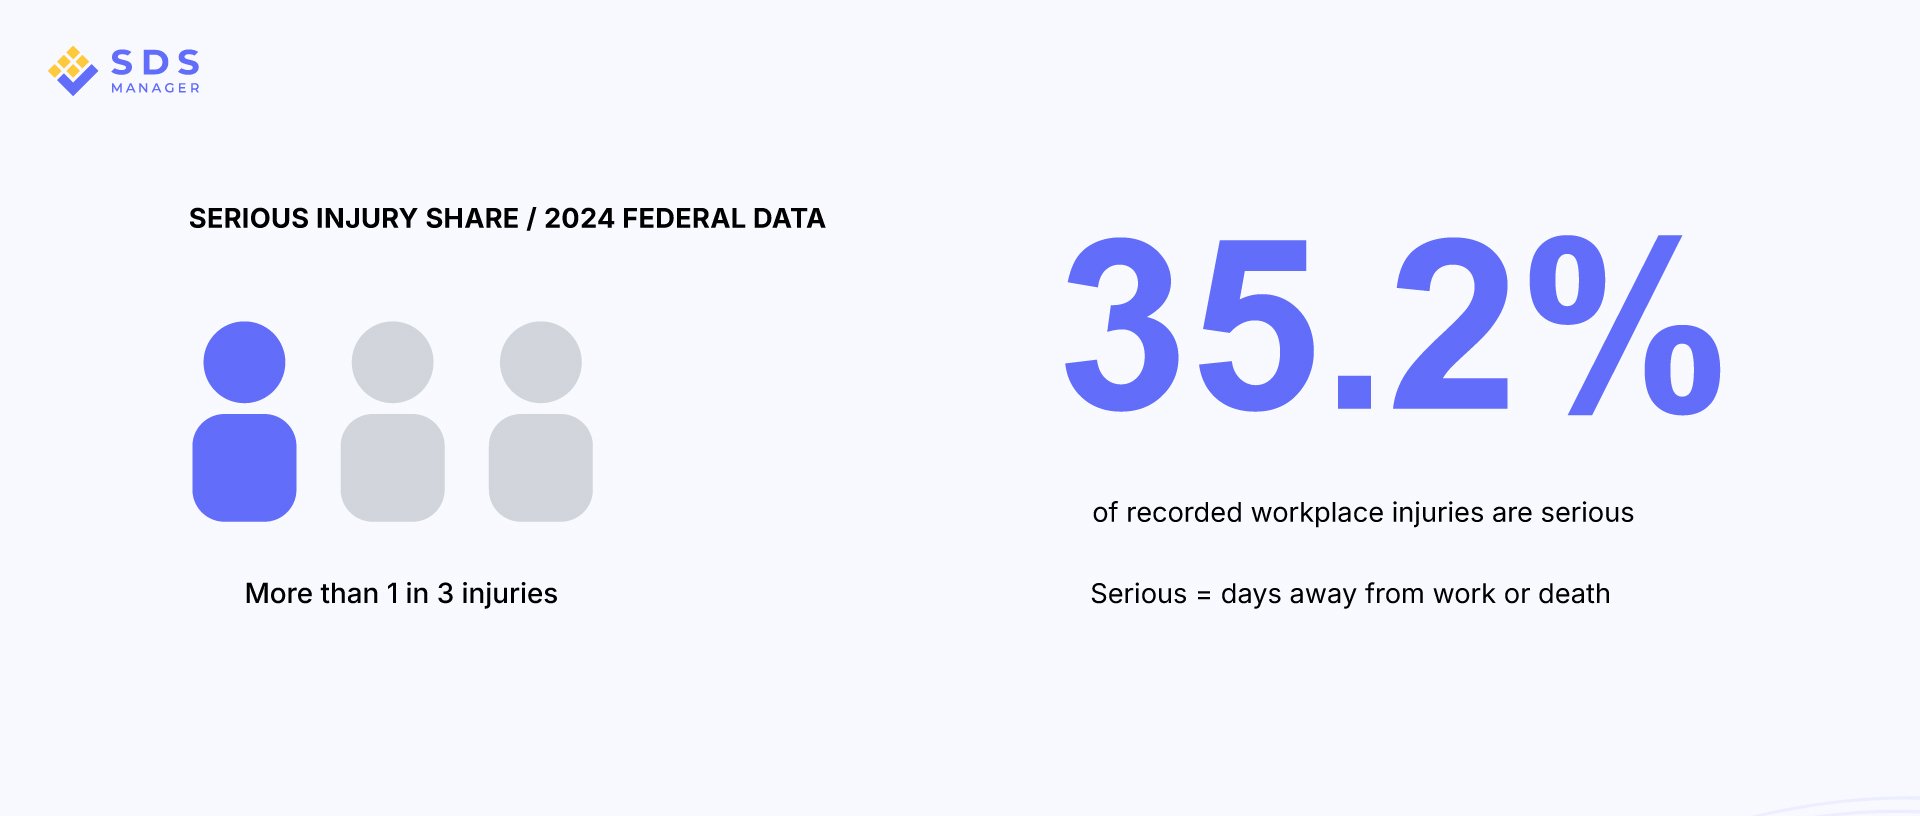
We looked at the most recent complete federal injury data, roughly 1.49 million recordable injuries in the Occupational Safety and Health Administration's Injury Tracking Application, and measured severity directly. The result is striking. More than one in three recorded workplace injuries is serious, meaning it costs a worker days away from the job or their life.
We call this the Serious Injury Share (SIS). It answers a question the injury count alone cannot: of the injuries that get recorded, how many are severe?
What is the Serious Injury Share?
The Serious Injury Share is the percentage of an organization's recordable injuries that result in days away from work or death, as opposed to minor cases handled with first aid or light duty. Nationally, it stands at 35.2 %.
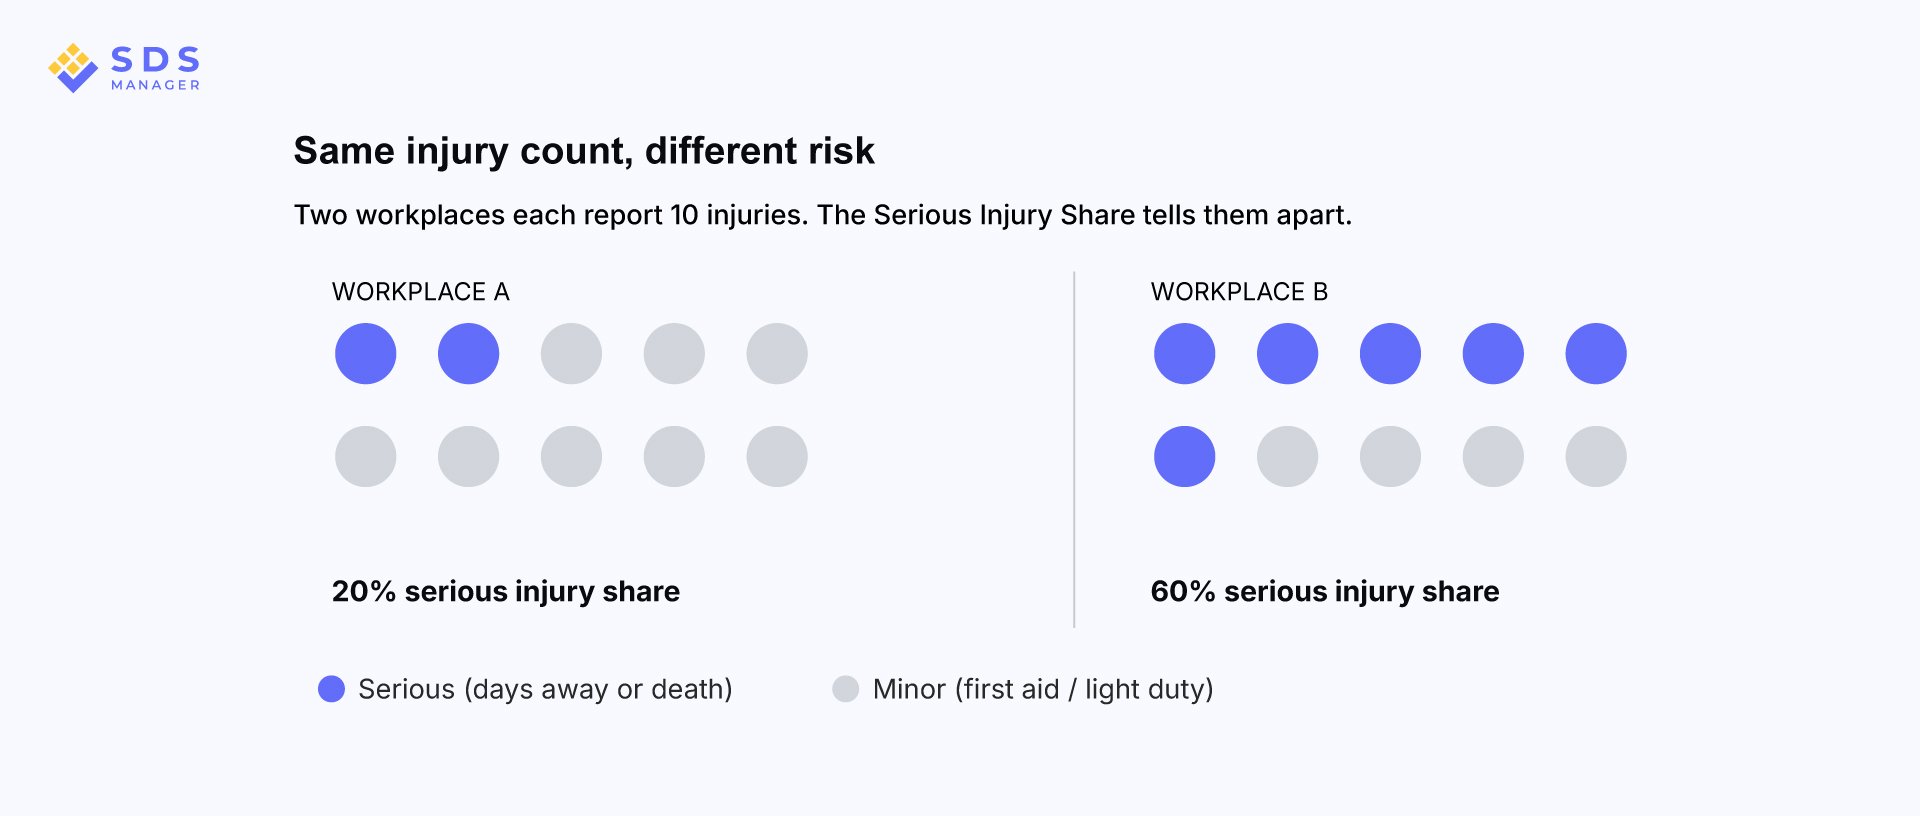
Two workplaces can report the same number of injuries and carry very different risk. The one with the higher Serious Injury Share is absorbing more lost time, more cost, and more human harm per incident. That is why severity deserves a seat next to frequency on every safety dashboard.
Which industries have the most serious injuries?
The severity is concentrated. Here is the Serious Injury Share across major industries in the latest data:
- Transportation and warehousing: 46.1 %
- Wholesale trade: 39.6 %
- Public administration: 39.1 %
- Administrative and waste services: 37.8 %
- Construction: 33.9 %
- Health care: 32.9 %
- Retail trade: 31.9 %
- Manufacturing: 30.0 %
- Educational services: 25.1 %
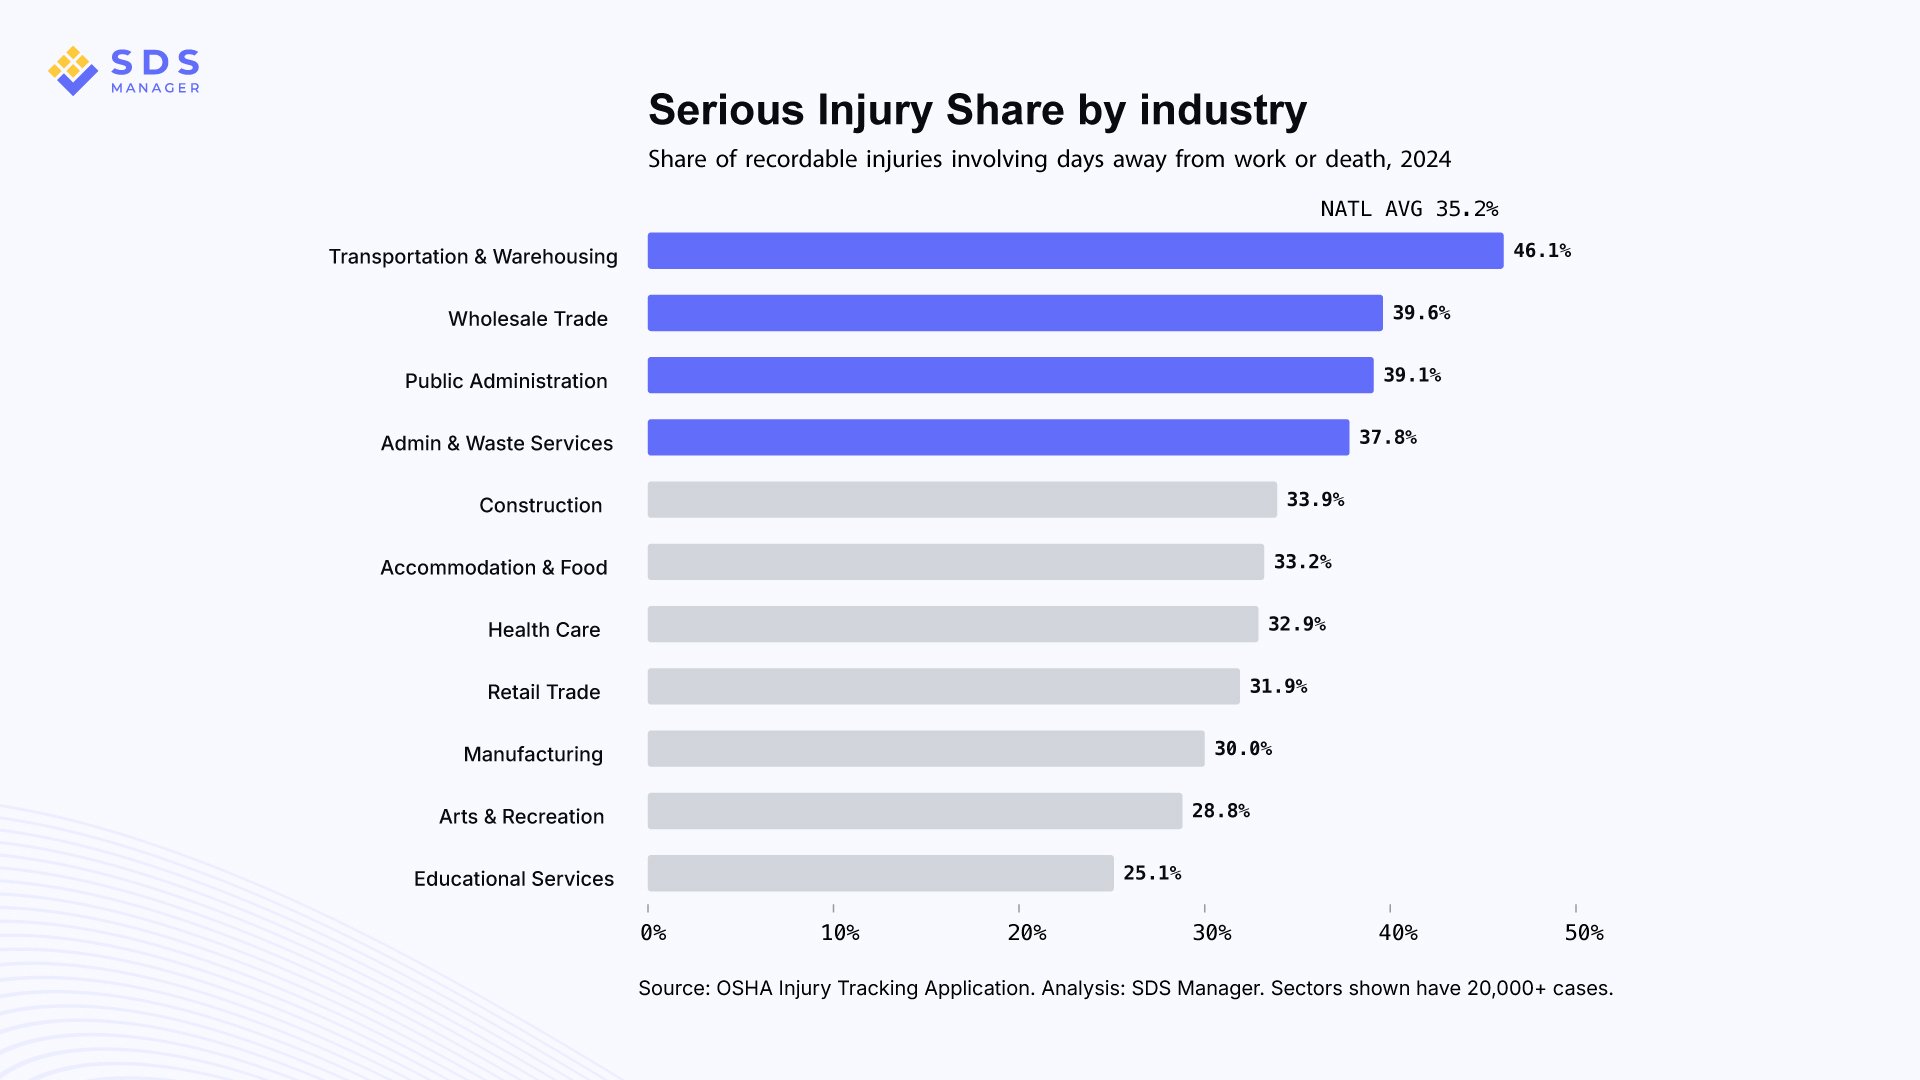
Transportation and warehousing stands out. Nearly half of its recordable injuries are serious, well above every other large sector. On more than 250,000 cases, that is a stable signal, not a fluke. The gap between the top and bottom sectors is close to two to one, which tells you severity is not spread evenly across the economy. It clusters.
How long are workers out after a serious injury?
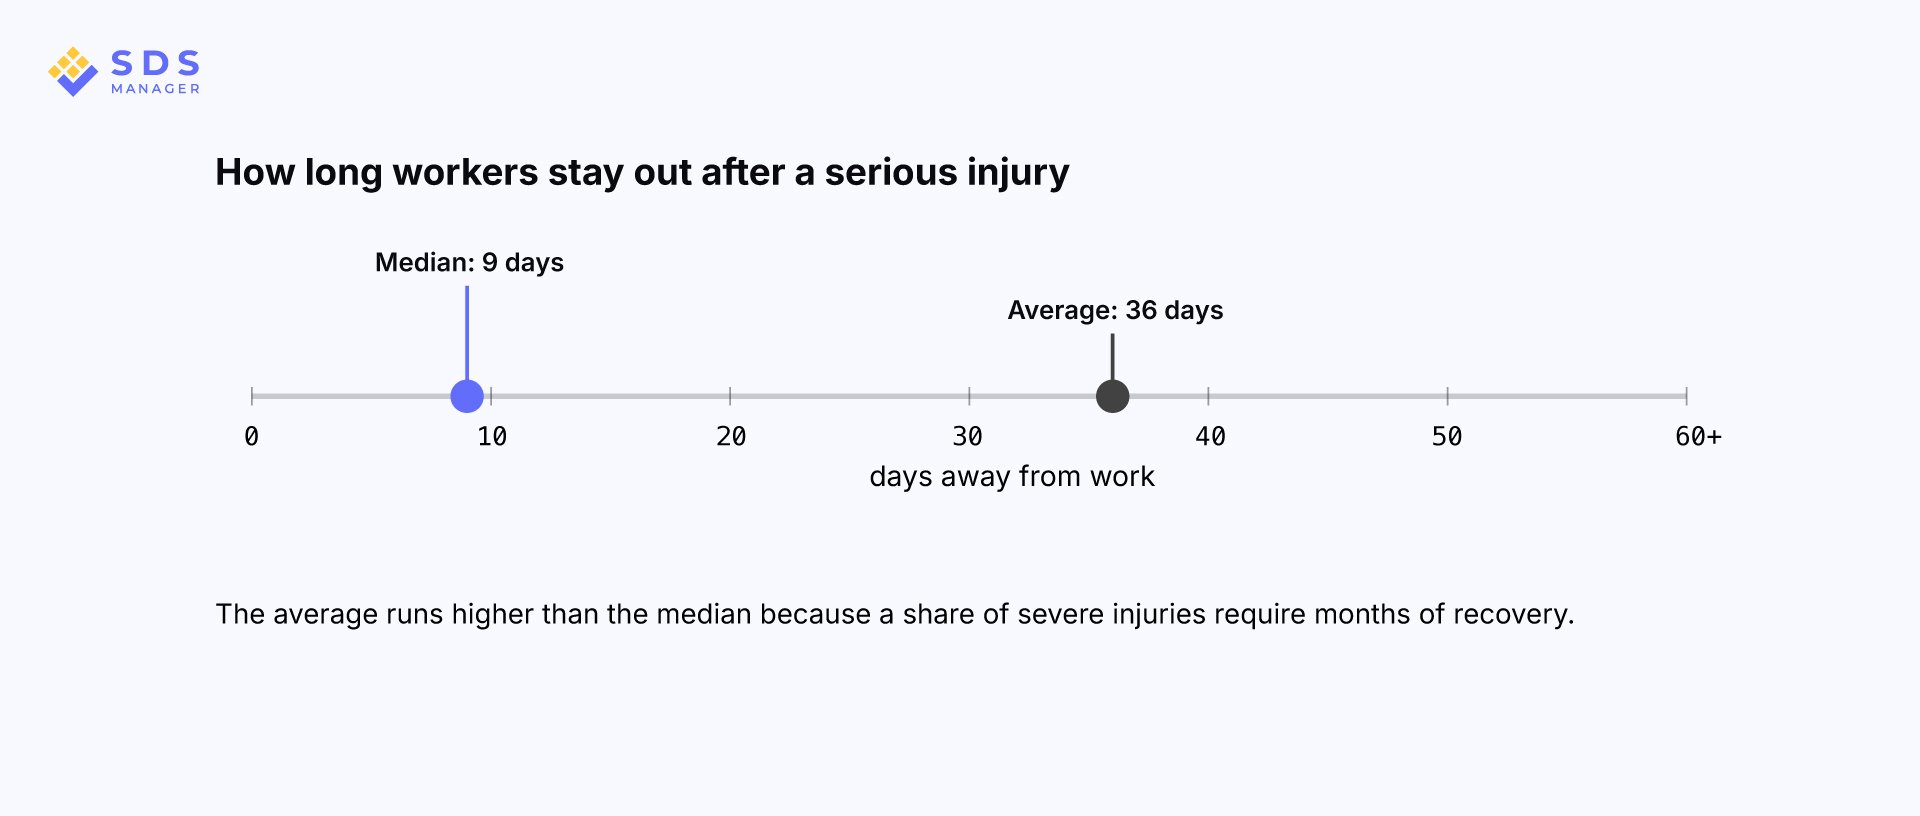
Recovery is not quick. The median days-away case keeps a worker off the job for nine days. The average runs to about 36 days, because a share of severe injuries require months of recovery and pull the mean up. Either way, a serious injury is a multi-week disruption to the worker and the operation.
Why does 2024 data matter in 2026?
Because it is the newest complete picture that exists. OSHA released this dataset in 2025, and it reflects employer filings due through early 2026. The 2025 data is still only partially submitted and will not be finalized, with injury classification coding, until 2027. When national bodies like the Bureau of Labor Statistics reported on workplace injuries in January 2026, they were reporting the same 2024 reference year. In workplace-injury statistics, this is what current looks like.
That timing matters for a practical reason. Safety leaders are setting 2026 priorities right now, and this is the freshest evidence available to guide where those resources should go.
What should safety teams do about it?
Three shifts follow from the data.
Track severity alongside frequency. Watch the Serious Injury Share next to total injury counts, so a falling case count does not hide a rising share of severe outcomes.
Target the concentration. If severity clusters in specific operations, that is where investigation and prevention effort earns the most return.
Close the loop on every serious injury. Connect each one to a structured investigation and a corrective action that closes with a verified fix, so the same hazard does not produce the next serious injury.
EHS solution by SDS Manager brings incident management, risk management, and audit into one connected system, so a serious injury opens a structured investigation and tracks the corrective action through to closure. See how it works.
Methodology: Computed from OSHA Injury Tracking Application public data for calendar year 2024, the most recent complete year, released by OSHA in 2025. Covers 398,620 establishment summaries and case-level records. Serious injuries are days-away and fatal cases as defined on OSHA Form 300A. Sectors shown have at least 20,000 recordable cases. The Serious Injury Share is SDS Manager's own metric and analysis; OSHA is the data source.
| Industry | Recordable cases | Days away | Fatalities | Serious cases | SIS % |
|---|---|---|---|---|---|
| Transportation & Warehousing | 251,365 | 115,828 | 164 | 115,992 | 46.1 |
| Wholesale Trade | 69,151 | 27,324 | 37 | 27,361 | 39.6 |
| Public Administration | 58,839 | 22,915 | 65 | 22,980 | 39.1 |
| Administrative & Waste Services | 39,943 | 15,046 | 54 | 15,100 | 37.8 |
| Construction | 72,997 | 24,558 | 160 | 24,718 | 33.9 |
| Accommodation & Food Services | 45,240 | 15,023 | 10 | 15,033 | 33.2 |
| Health Care & Social Assistance | 367,095 | 120,677 | 36 | 120,713 | 32.9 |
| Retail Trade | 214,693 | 68,371 | 37 | 68,408 | 31.9 |
| Manufacturing | 254,446 | 76,120 | 141 | 76,261 | 30.0 |
| Arts, Entertainment & Recreation | 25,750 | 7,400 | 9 | 7,409 | 28.8 |
| Educational Services | 21,032 | 5,270 | 5 | 5,275 | 25.1 |
How the number is calculated
The Serious Injury Share is a simple ratio anyone can verify:
Serious Injury Share (SIS) = (Days Away Cases + Fatalities) / Total Recordable Cases × 100
Worked example — Manufacturing, 2024
- Recordable injuries: 254,446
- Days away cases: 76,120
- Fatalities: 141
- Serious cases: 76,261 (76,120 + 141)
- SIS = 76,261 / 254,446 = 30.0 %
Limitations
This analysis is based on OSHA Injury Tracking Application submissions. Underreporting or reporting inconsistencies by employers may affect industry estimates. The Serious Injury Share measures severity among reported recordable injuries and should not be interpreted as an industry's overall injury frequency or rate per worker. Coverage is limited to establishments meeting OSHA size and industry reporting thresholds, and NAICS codes and case counts are self-reported. The Information sector shows a higher raw share (58%) on a small base of about 5,500 cases and is excluded from the headline figures for that reason.
Download the data
The full dataset is published in open formats so anyone can recreate the charts, verify the statistics, or build on the analysis:
Frequently asked questions
What share of workplace injuries are serious?
In 2024, 35.2 % of recordable U.S. workplace injuries were serious, meaning they resulted in days away from work or death. That is based on roughly 1.49 million recordable injuries reported to OSHA, so more than one in three recorded injuries was serious.
What is the Serious Injury Share?
The Serious Injury Share is the percentage of an organization's recordable injuries that result in days away from work or death, calculated as serious cases divided by all recordable cases. It measures severity rather than frequency.
Which industry has the most serious workplace injuries?
Among major industries, transportation and warehousing had the highest Serious Injury Share in 2024 at 46.1 % , meaning nearly half of its recordable injuries were serious. Educational services had the lowest at 25.1 % .
How long do workers stay out after a serious injury?
In 2024, the median days-away case kept a worker off the job for nine days, and the average was roughly 36 days, because a minority of severe injuries require months of recovery.

Mehreen Iqbal

Started with a Bachelors in Microbiology, then a Masters in Public Health; Currently a Workplace Safety Expert.